When the result has to survive being challenged
There is research where a wrong number does not cost money. It costs the credibility of everything else, and that you do not get back.

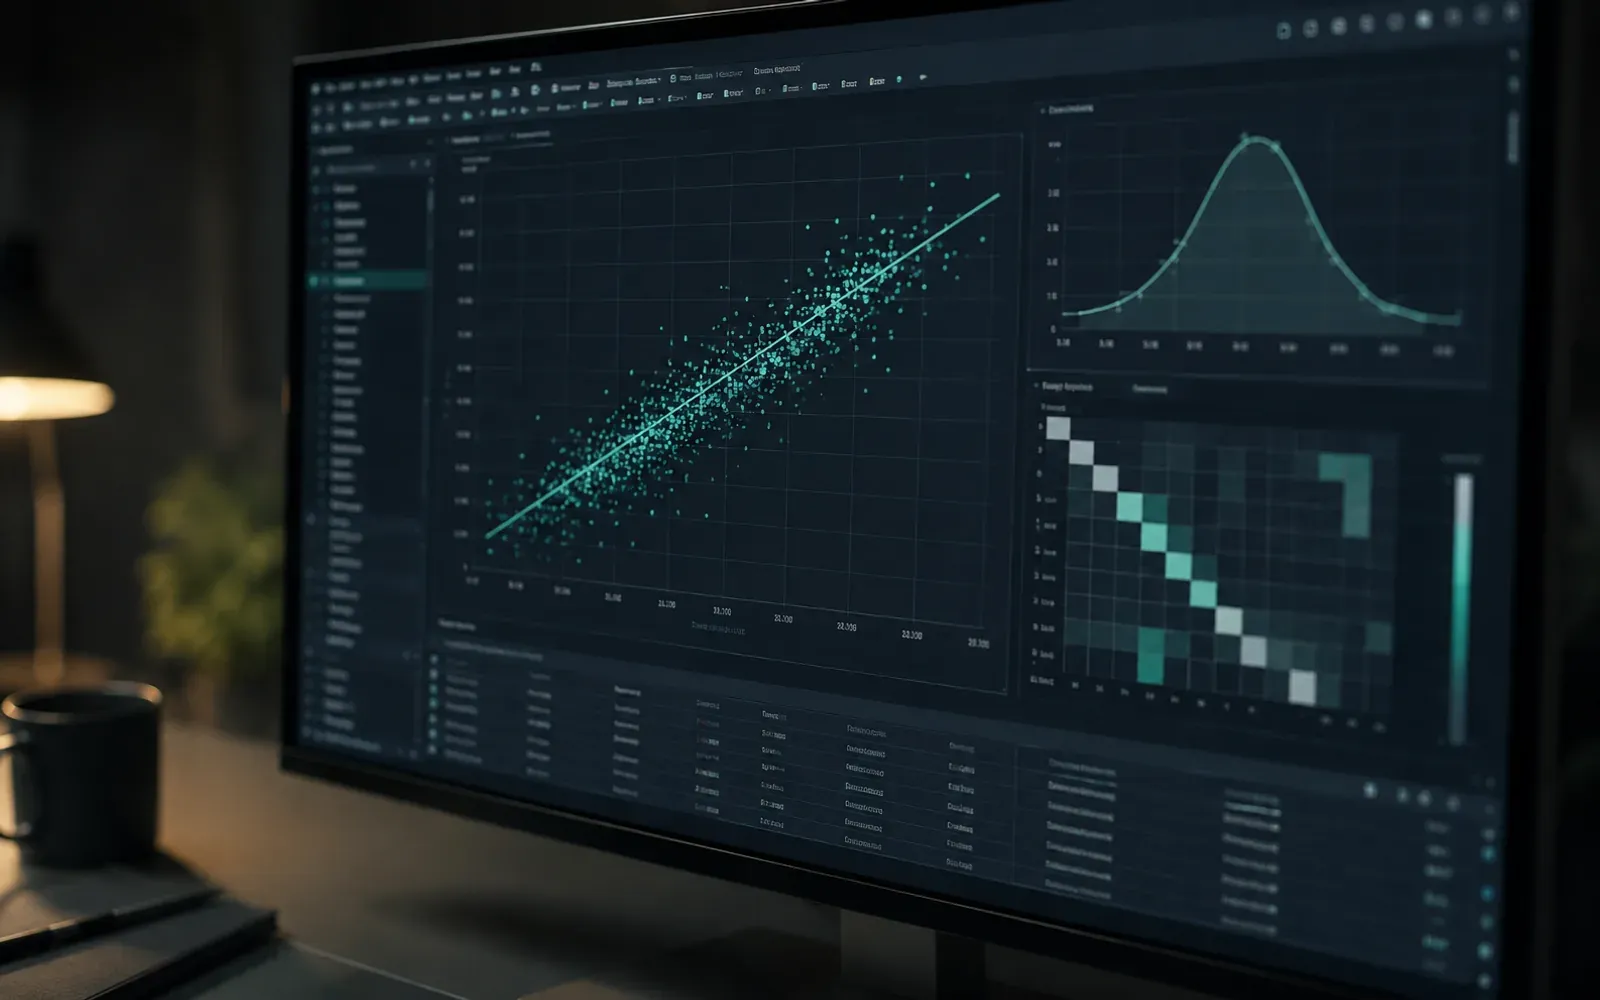
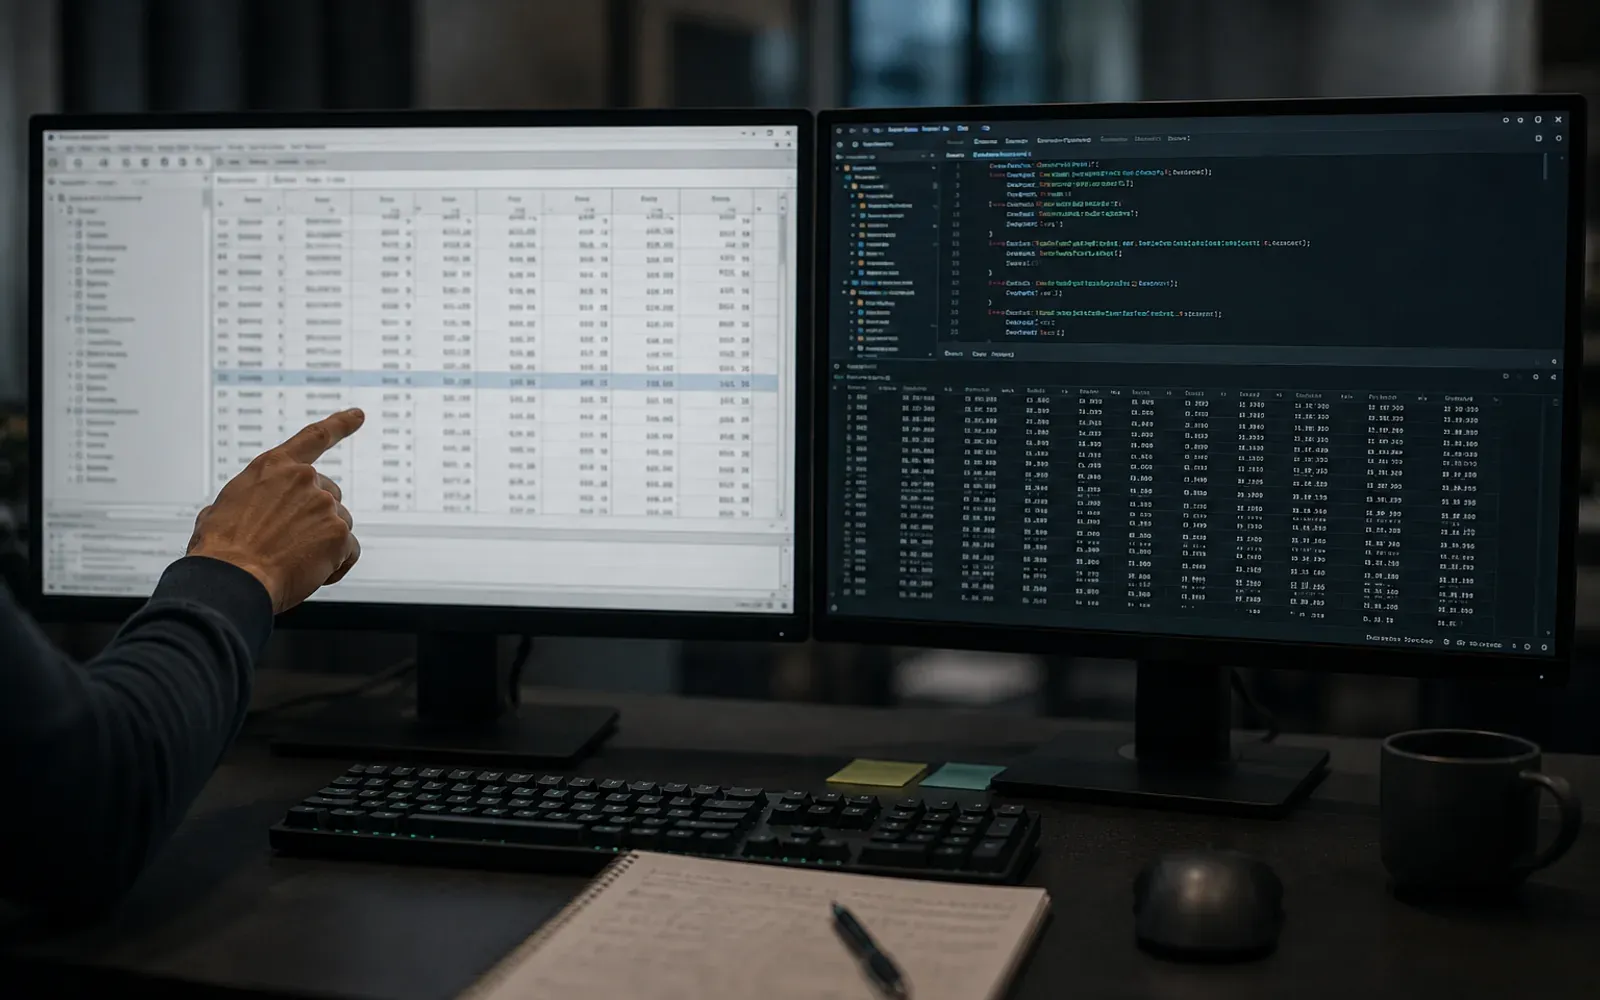
The images on this page are indicative of the kind of work involved. They are not screenshots of what was delivered and do not represent the study's data or results.
The Challenge
The Solution
Before you analyse, you tidy up
Of the several hundred responses the research had collected, we kept a little over 250. The bar was deliberately high: only the people who had answered everything got through. We could have estimated the missing values, which is what is usually done in these cases, and we would have ended up with a larger sample. But every estimated value leaves an opening for anyone who wants to contest the work, and here we could not leave a single one.
Questions become numbers
More than a hundred questions had to go from text to number, one by one. Some of them were worded back to front on purpose, to catch people answering on autopilot, and those had to be reversed before they could count. Only once all of that was done could the scales be summed. And before we used them, we measured how internally consistent each one was, because a scale that is not consistent ends up not measuring what it claims to measure.
Only then do you analyse
Before running any test at all, we checked whether its assumptions held. A test applied where it does not belong produces a good looking number worth nothing at all. Only then did we move on to the group comparisons, to the correlations and to a model that would tell us which, out of eighteen possible factors, actually carried weight. Eight did. The final model accounts for about a third of what the research set out to explain, which, in survey data, is a solid result.
Everything calculated twice
This is where the work sets itself apart. We rebuilt the whole analysis in a second program, written from scratch and with no connection to the first, and compared the two sets of results value by value. Then we went further and ran 188 analyses down two different statistical routes, to see whether the conclusions held on both sides. They held on 184. On the ones that carry the core of the research, agreement was total.
Every decision with its reason
Every methodological decision was written down, and each one can be followed back to the exact line of data it came from. There are twenty-two routines, and any one of them can be run again from the beginning to give exactly the same result. This is not bureaucracy. It is what lets you answer a hard question months later with the answer already at hand, instead of having to reconstruct it from memory.

We went looking for our own mistakes
Before delivering, we went back over the whole thing looking for mistakes of our own. We found two, a badly parameterised calculation and a set of dispersion values, and corrected them. Better that we find them than someone else. What went out for delivery did not have a single value left unconfirmed.
The path we walked, from day one to final delivery.
Discovery Session
We listened carefully to understand the research, the data that already existed, and the level of scrutiny it would have to withstand.
ADDS Roadmap
We mapped the plan before touching the data: which entry criteria to adopt, which test to apply to each question, and in what order to proceed.
ADDS Create
We ran the plan end to end, from preparation to the final analyses, with independent verification, robustness testing and all the supporting documentation.
In the end, what remained was not just a set of results. It was the assurance that any one of them holds up to the hardest question of all: and how exactly did you get there?
What this case does not say, and why
It does not say the client's name. It is fair to ask whether a case with no name is an invented one. It is not. What is missing here is not the client, it is their permission to name them. We do not have it, and without it the name does not appear. Nothing else is missing: the work is what was done and the numbers are what was measured. And if the discretion looks like a flaw in a case study, consider that it is exactly what you will want when the case is yours.
Have a project in mind?
Let's have a 30-minute conversation with no strings attached and see if it makes sense to work together.
Book a Discovery Session