Over €1m of invoicing that kept slipping, month after month
There was too much data and too little certainty. Before every management meeting the numbers were rebuilt by hand just to confirm they were right. And once in the room, the conversation went to where each figure had come from, rather than to the business.
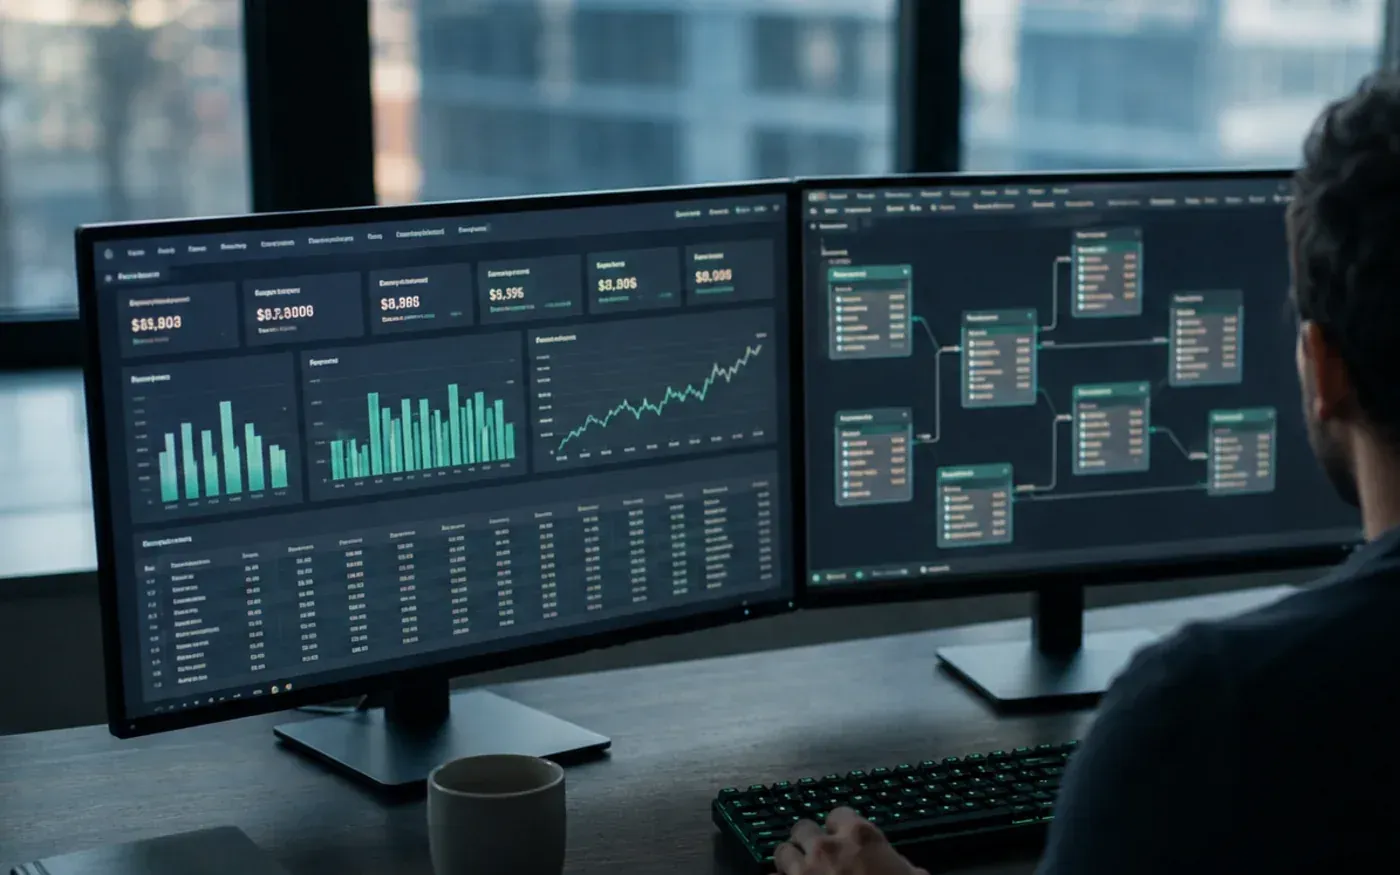
The images on this page are indicative of the kind of work involved. They are not screenshots of what was delivered and do not represent the client's data or dashboards.
The Challenge
The Solution
Rationalising the architecture
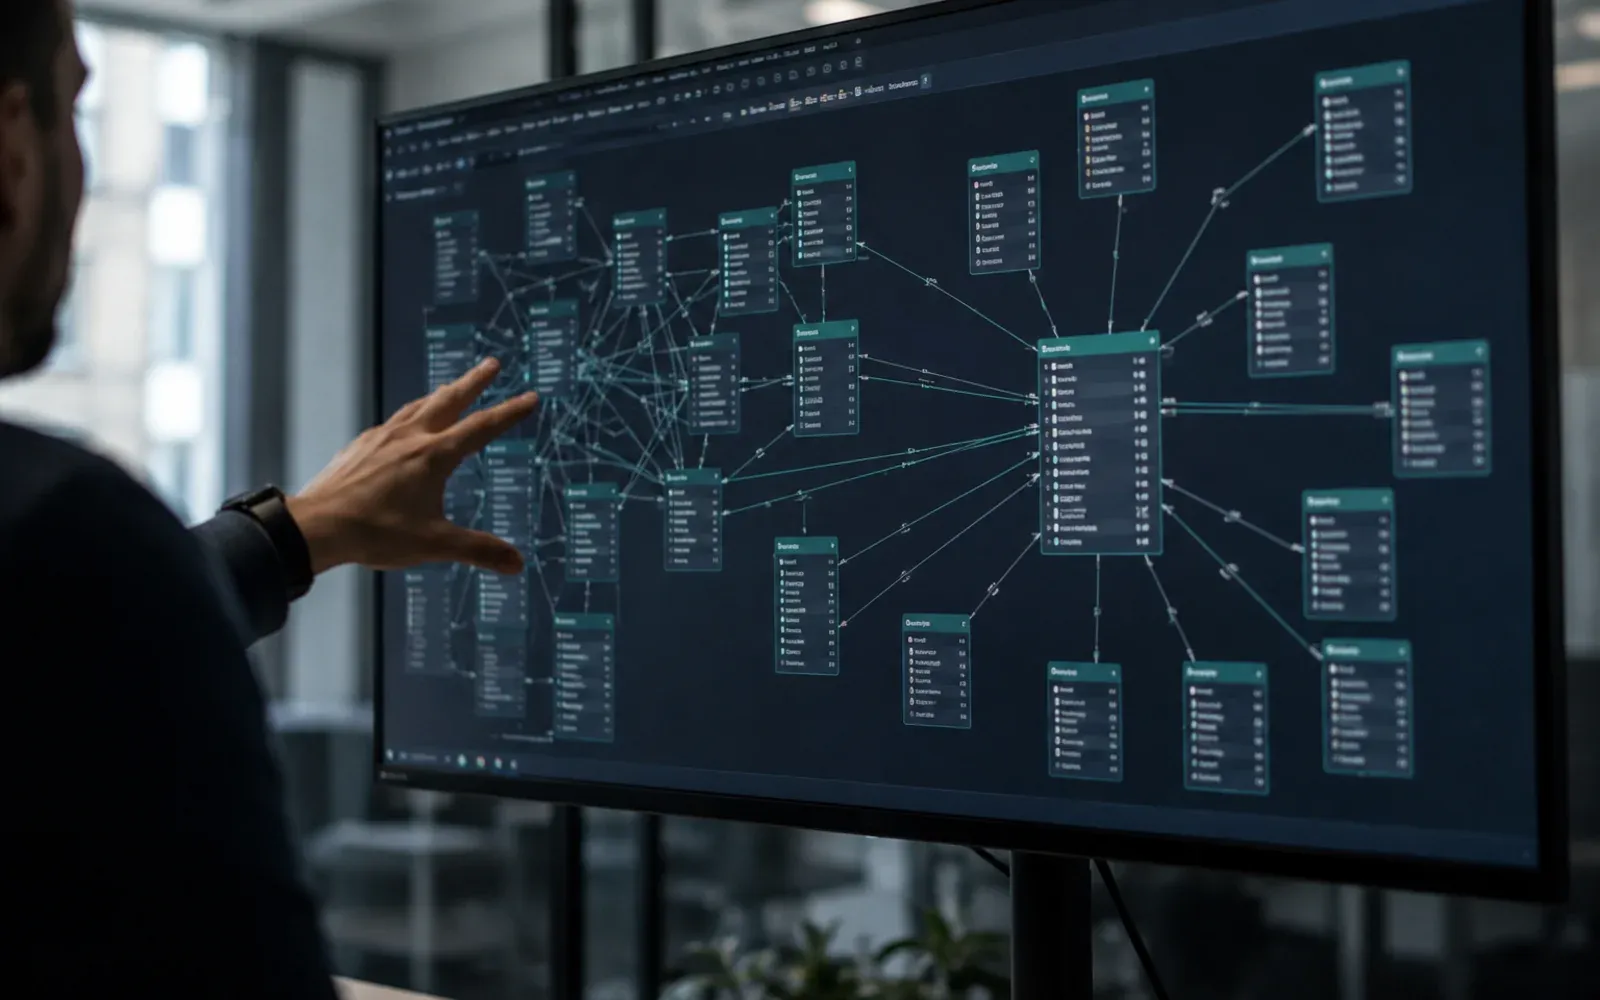
We rebuilt the model instead of patching it. It ended up with less than half the tables and lost no analytical capability. Where a single calendar had been serving everything, there are now three: sales, invoicing and collections. Selling, invoicing and getting paid happen at different moments, and the model now knows that.
Consolidating the analytics layer
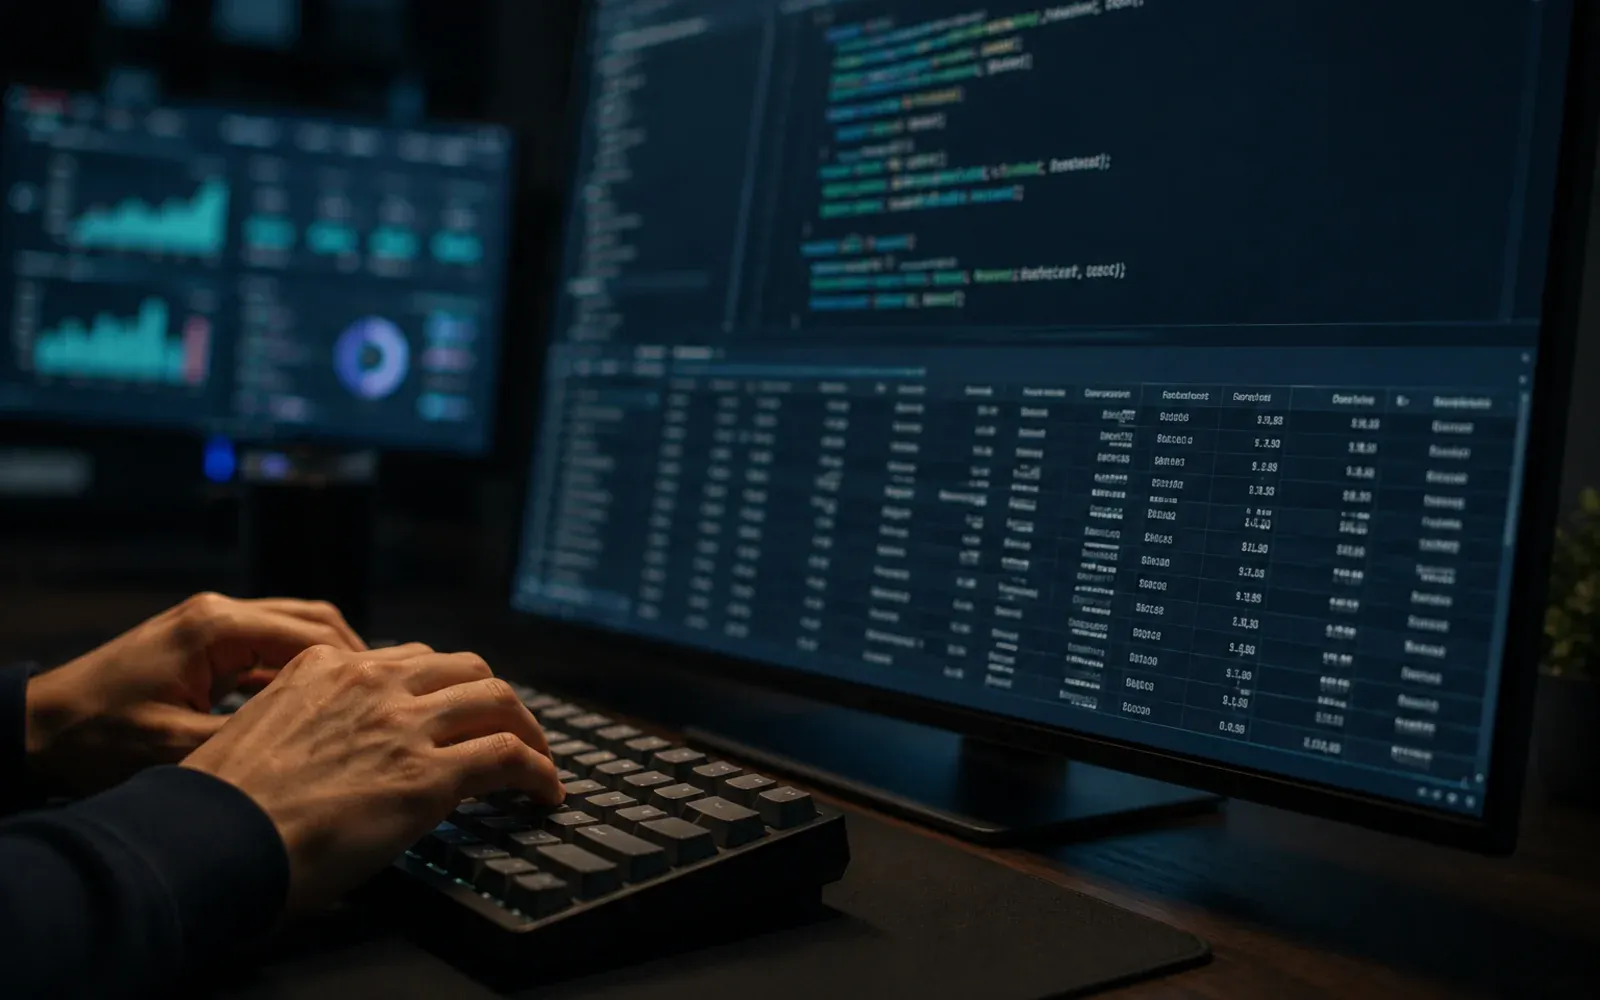
The indicators lived scattered across fourteen structures, and the same calculation could read differently depending on where you looked. We consolidated 97% of them into one. It is a change you cannot see on a screen, but it is what makes two people, in two departments, arrive at the same figure. Before signing off any indicator, we checked it against real business cases, the kind whose answer was already known.
Restructuring the reporting
Each page now answers a business question instead of showing a table. The number of pages went down and the number of visuals went up. It sounds contradictory but it is not: fewer places to look, more answers in each place. Whoever opens the report sees the answer first and the detail afterwards, if they want it.
Automatic detection of invoicing slippage
There is invoicing that is planned for a month and does not go out. It moves to the next month, and then the one after, and it dissolves until nobody notices: deferred, or simply never issued. That is what invoicing slippage is, and the existing setup did not flag it, so there was no way to catch it in time. We tested the obvious approach and set it aside once we had measured it: it let almost three quarters of the value slip through. The engine we built reconciles to €0.00 of variance in 12 of 12 months. That zero is not technical vanity, it is proof the numbers survive being checked. It is what made over €1m of slipping invoicing visible, and around half of that has since been recovered.
The reports that go into the room
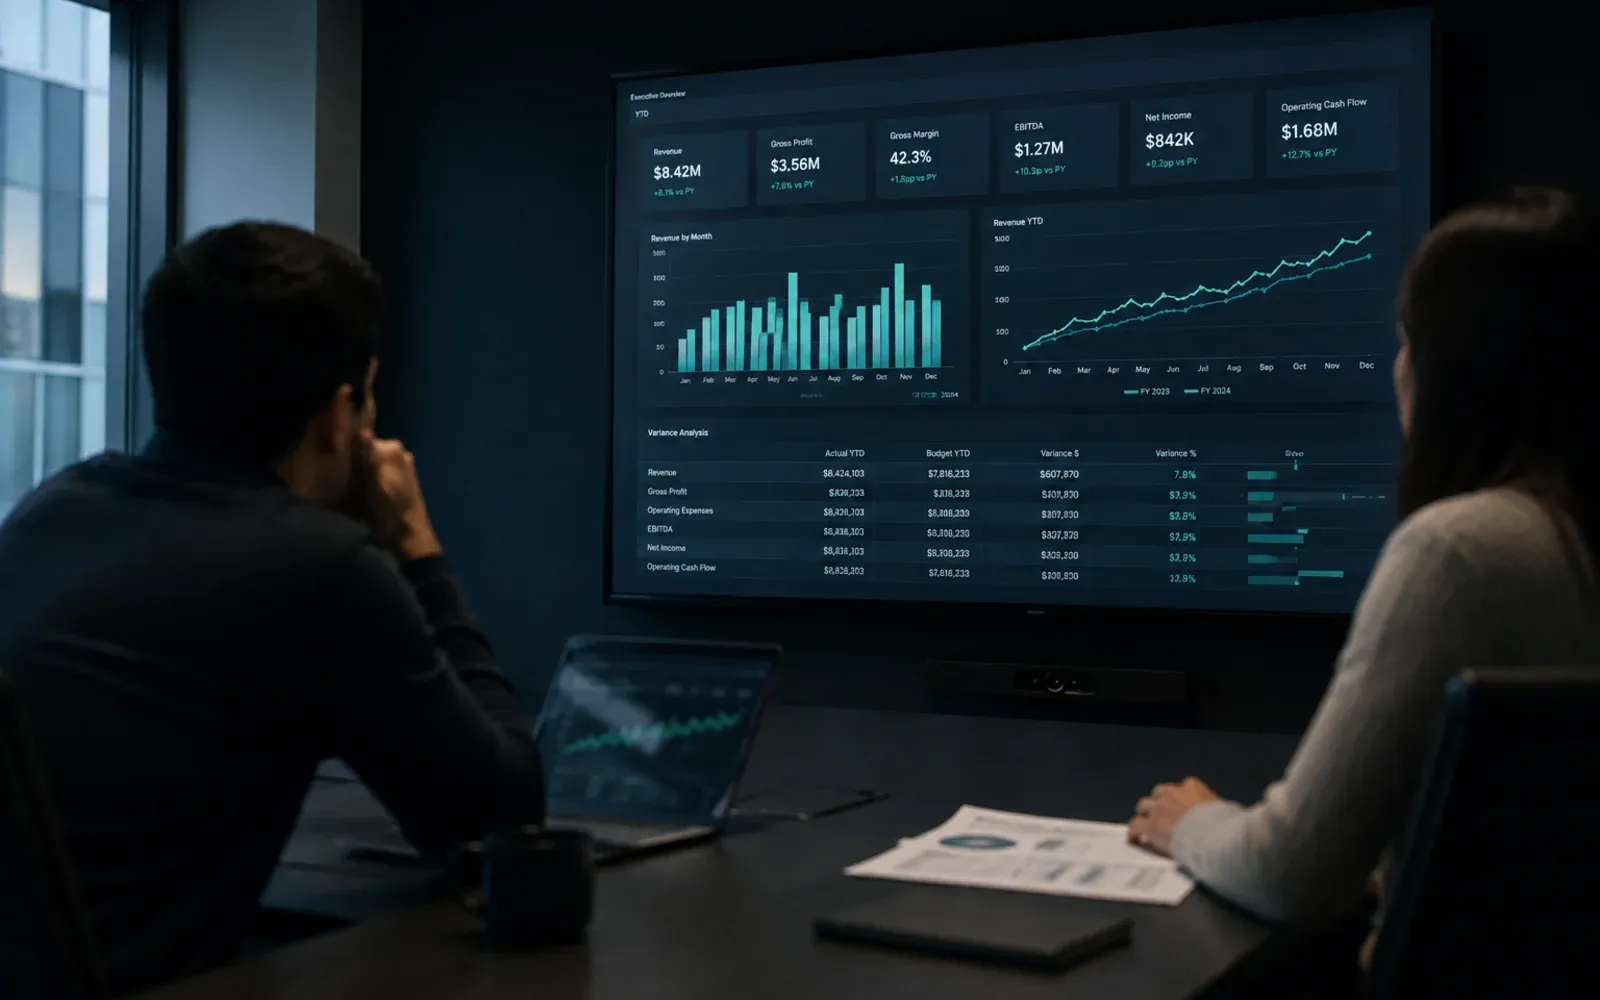
There are reports that stay on a screen and reports that go into the meeting room. We built the second kind. They cover seven years of history and forecasts out to 2029, which answers both "how did we get here" and "where are we going" without switching screens. The finance team no longer has to rebuild the numbers before trusting them. The conversation in the room now starts with the business, not with where a figure came from.
Enablement
We trained the finance department, who then took the new way of working to the rest of the company. We left the business rules written inside the model itself, instead of living in one person's head. Nobody should need a supplier to read their own data. The partnership has been running since 2025, in fortnightly or monthly cycles.
What we found
What we delivered
The path we walked, from day one to ongoing care.
Discovery Session
We listened to the finance team to understand what was getting in the way of a clear reading of the business. It became clear the problem was not a lack of data.
ADDS Review
We audited the inherited model, the ERP sources and the analysis processes in use, before proposing any change at all.
ADDS Create
We rebuilt the model, consolidated the indicators into a single structure and reorganised the reports around business questions, in short cycles with validation at every step.
ADDS Care
We are still working alongside them, in fortnightly or monthly cycles: new reports, new data topics, and training for the people who use them.
In the end, what changed was not the tool. It was the finance team being able to look at a number and decide, without rebuilding it first.
What this case does not say, and why
It does not say the client's name. It is fair to ask whether a case with no name is an invented one. It is not. What is missing here is not the client, it is their permission to name them. We do not have it, and without it the name does not appear. Nothing else is missing: the work is what was done and the numbers are what was measured. And if the discretion looks like a flaw in a case study, consider that it is exactly what you will want when the case is yours.
Have a project in mind?
Let's have a 30-minute conversation with no strings attached and see if it makes sense to work together.
Book a Discovery Session